results - Harmful Algal Bloom (HAB) transport
transport pathways
We used particle tracking to determine dominant transport pathways for HABs to move from known source regions (the Juan de Fuca Eddy and Heceta Bank) to the Washington coastline. We released 1000 passive particles from the two source regions and tracked their pathways over two weeks. This experiment was repeated throughout an entire year and was then compared to measurements of PN cell counts at the beach. We have found that the model confirms two suspected transport pathways and matches time series of observed PN at the beach. In particular, fall events tend to be associated with transport from the Juan de Fuca Eddy region requiring upwelling winds (northerly) followed by relaxation or downwelling (southerly). Spring events are associated with transport from Heceta Bank during strong downwelling.
Figure 1. Juan de Fuca Eddy Particle Tracking
This movie shows particles that reach Long Beach, WA from the Juan de Fuca Eddy source region. The left panel shows particle paths (red line indicates where the particle has been, red dot is the current particle location) on top of the modeled surface salinity field (darker blue is fresher). The right panels show forcing conditions. The upper two panels indicate the along-coast and across-coast winds respectively and the wind stress (black) and 8-day weighted mean (grey line, Austin & Barth 2002) are both included. The bottom panel shows the Columbia (blue) and Fraser (cyan) River flows. A red line indicates the time stamp. Upwelling winds allow particles to escape the retentive eddy, while later downwelling winds allow those particles to get to the coast.

Figure 1. Heceta Bank Particle Tracking
This movie shows particles that reach Long Beach, WA from the Heceta Bank source region. The left panel shows particle paths (red line indicates where the particle has been, red dot is the current particle location) on top of the modeled surface salinity field (darker blue is fresher). The right panels show forcing conditions. The upper two panels indicate the along-coast and across-coast winds respectively and the wind stress (black) and 8-day weighted mean (grey line, Austin & Barth 2002) are both included. The bottom panel shows the Columbia (blue) and Fraser (cyan) River flows. A red line indicates the time stamp. Downwelling winds and entrainment into the Columbia River plume allow particles to be transported from the Oregon coast to the Washington coast.
comparison to observed beach events
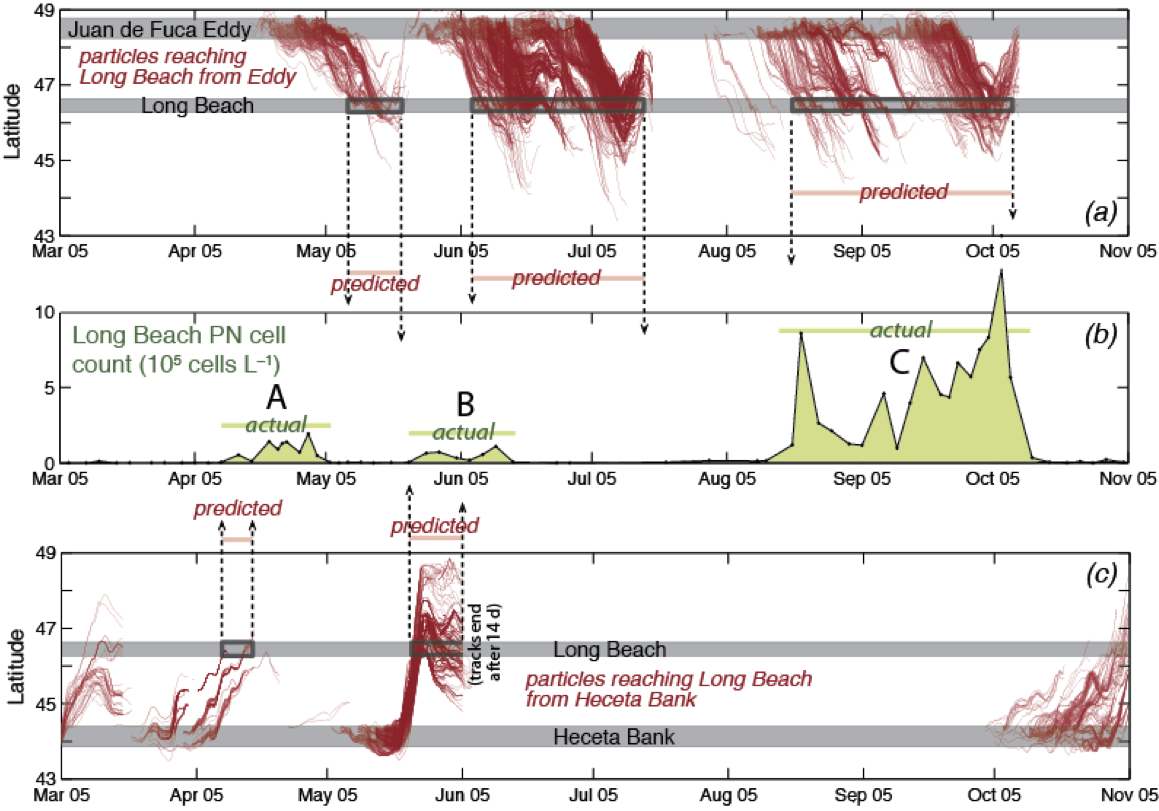
Figure 2. Long Beach, WA HAB events
This figure compares observed beach events with model predictions based on physical transport alone. The middle panel (b) contains a time series of PN cell count measured at Long Beach, WA collected by the Olympic Regional Harmful Algal Bloom program (thanks to V. Trainer and A. Odell). The top and bottom panels show particle paths (latitude versus time) for only those particles that reach Long Beach, WA coming from the (a) Juan de Fuca Eddy source region and the (b) Oregon Heceta Bank source region. Lines on the plots indicate both actual and predicted HAB events at Long Beach, WA. The first two predicted events originating from the JdF Eddy do not line up with observations and thus are false-positives. The other events indicate the fall event was associated with a JdF Eddy source region and the spring events were associated with transport from the southern Heceta Bank source region.
incorporation of biogeochemical model
The biogeochemical model was able to help reduce the number of false positives identified from physical transport pathways alone.