PNWTOX validation - physics
observations - CTD vertical profiles
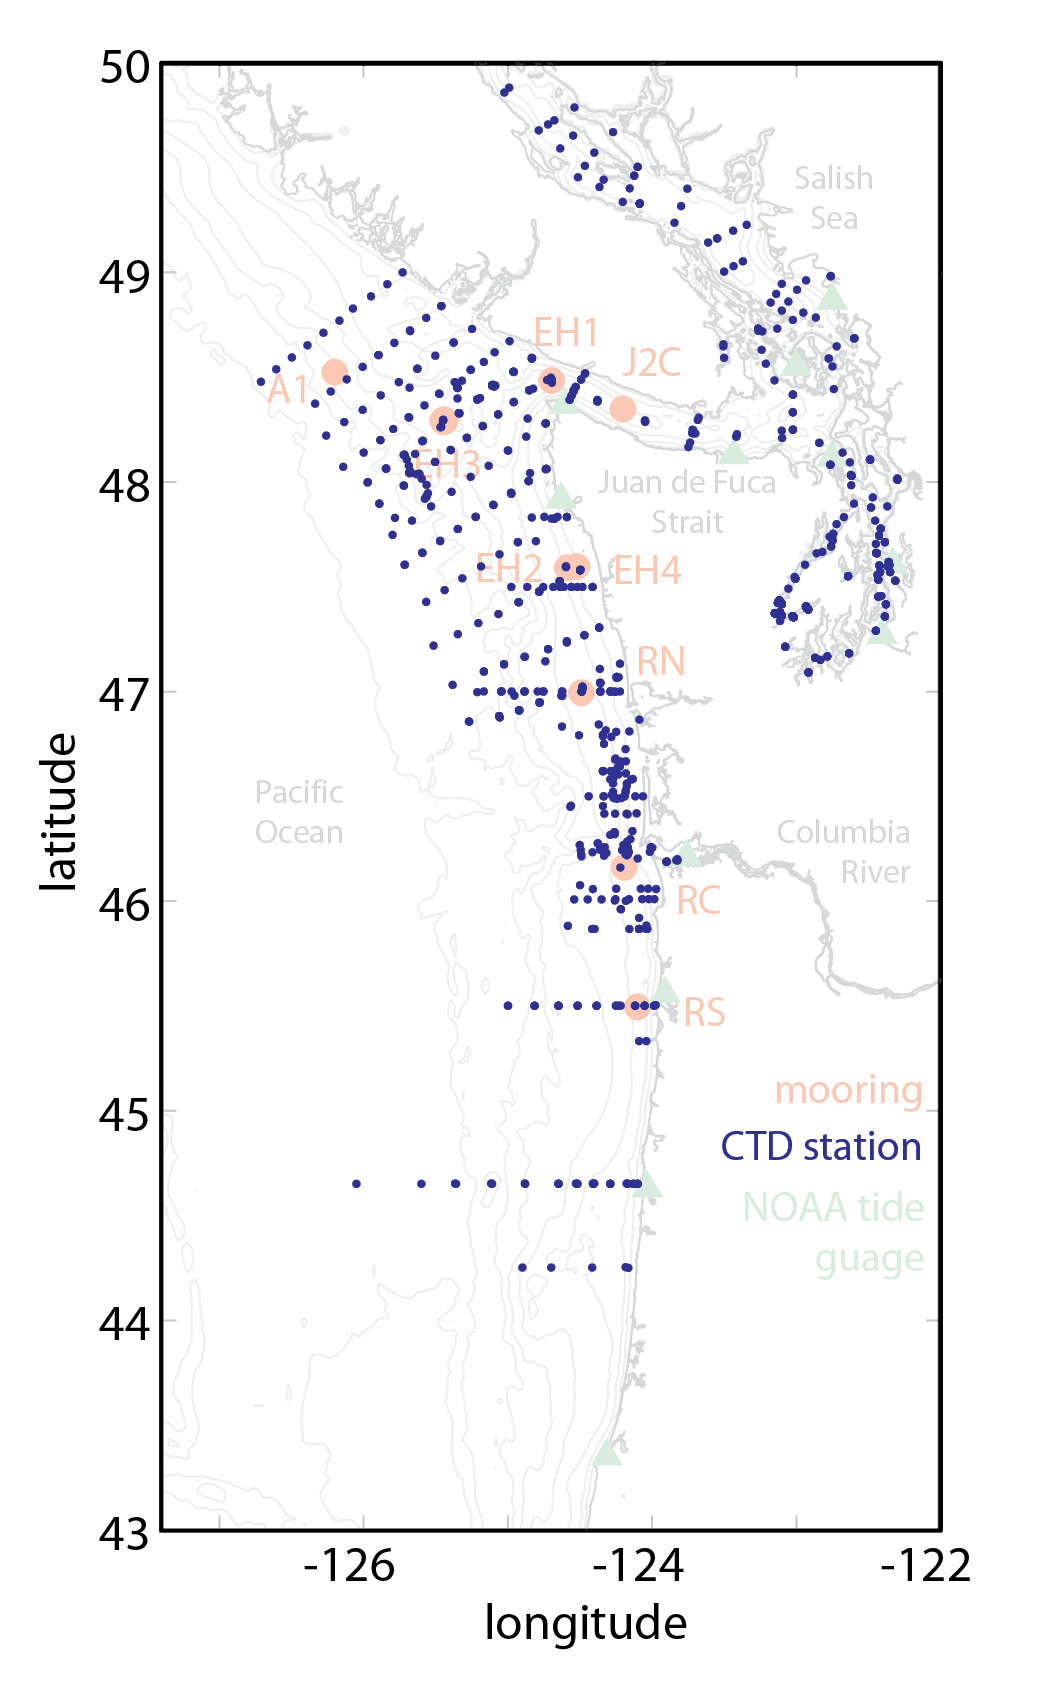
2005 in-situ observations
Moorings are marked in red circles. The RISE project (RN, RC, and RS) and the ECOHAB-PNW project (EH1, EH2, EH3, and EH4) deployed moorings during summer 2005 that included bottom mounted ADCPs and moored CTDs at multiple depths. IOS deployed a bottom mounted ADCP in the Juan de Fuca Strait (J2C) and current meters and CTDs at 4 depths offshore (A1) nearly continuously through the year. CTD casts, marked in blue dots, were conducted throughout the region and year as part of a variety of sampling projects including the ECOHAB-PNW project, RISE project, DOE, PRISM, Hood Canal, IOS, King County, and NOAA. NOAA tide gauges with data throughout the year are marked in green triangles.
Special thanks to B. Hickey (multiyear moored sensors and CTD data from the ECOHAB-PNW and RISE projects), E. Dever (multiyear moored sensors from the RISE project), R. Thomson (moored arrays and CTD data, Fisheries and Oceans Canada Institute of Ocean Sciences, IOS), V. Trainer and A. Odell (PN cell count data, Olympic Regional Harmful Algal Blooms Partnership, ORHAB), B. Peterson (multiyear Oregon CTD data), the National Oceanic and Atmospheric Administration (NOAA, CTD data and tide gauges), the Olympic Coast National Marine Sanctuary (OCNMS, multiyear Washington moored sensors), the Puget Sound Regional Synthesis Model (PRISM, Puget Sound CTD data), Washington State Department of Ecology (DOE, Puget Sound CTD data), King County Puget Sound Marine Monitoring (Puget Sound CTD data), and the Hood Canal citizen monitoring project (Hood Canal CTD data) for use of their data.
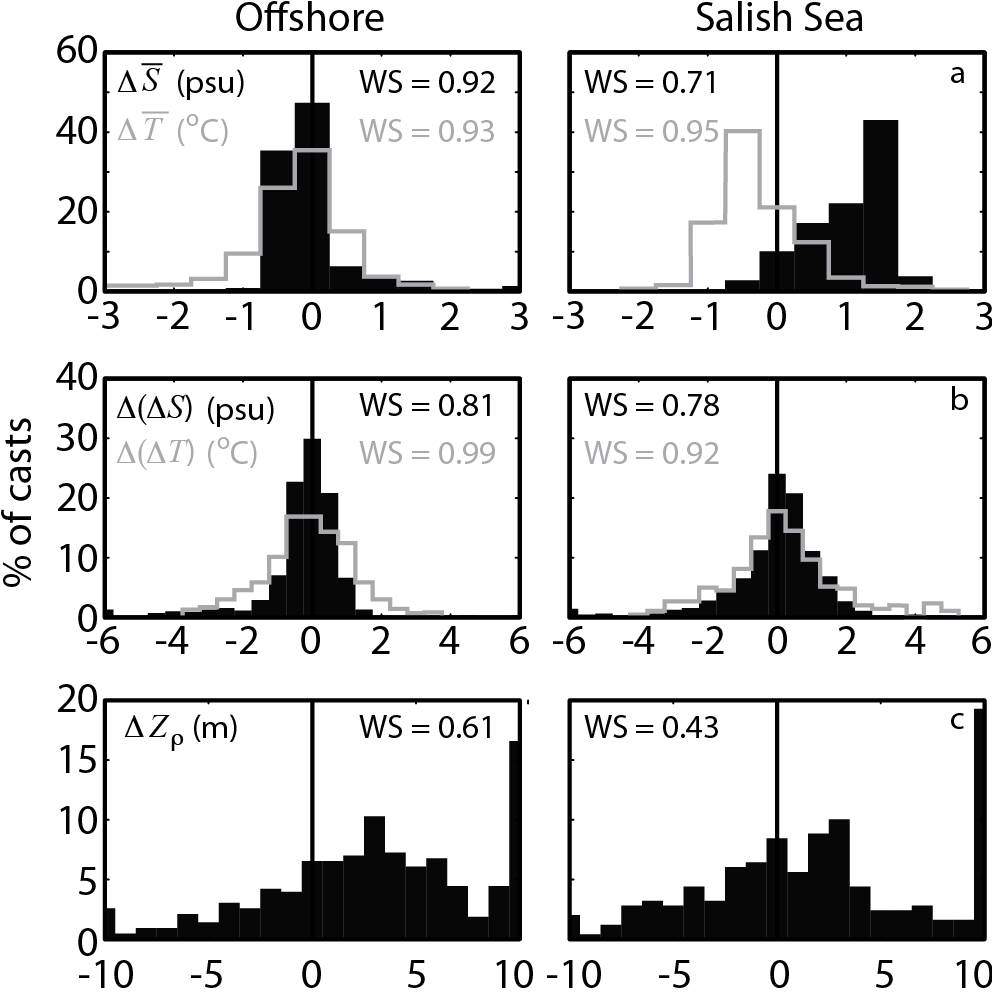
2005 CTD station histograms
Histograms of the difference between modelled and observed a) depth average salinity (black) and temperature (gray), b) two layer stratification, and c) the depth of the pycnocline.
Click on the map above or go back for more validation figures!